


 44 / 514

Analysis of Bilateral Trade Between EU-15 and Selected Balkans and Black Sea Countries
33
n
export to and import from the BBSCs (Appendix Table A1 and Table A2); the share of BBSCs in total exports of
these four countries is between 5 % (in Germany) and 22 % (in Greece). On the other hand, when we look at the
period between 1996 and 2012, the shares of EU-15 in total trade of BBSCs have a decreasing trend except Russia,
Bulgaria, and Ukraine which seems to have increased over the period (Table 1 and Table 2).
Table 1:
Share of EU-15 in BBSCs’ Total Exports, 1996-2012 (%)
Year Albania Bulgaria Croatia Georgia Romania Russia Slovenia Turkey Ukraine
1996
86
39
51
8
57
29
65
50
12
1997
87
43
51
8
57
33
64
47
14
1998
92
50
48
19
65
32
66
50
19
1999
95
53
49
21
66
34
66
54
21
2000
93
51
55
21
64
26
64
52
18
2001
91
55
54
18
68
27
62
51
20
2002
92
56
53
17
67
27
59
51
21
2003
93
57
55
17
68
27
58
52
20
2004
90
54
51
16
66
29
58
52
18
2005
88
50
48
17
60
34
59
49
17
2006
88
49
49
15
58
35
59
48
17
2007
82
48
44
14
58
36
57
47
16
2008
78
46
44
12
55
34
55
39
14
2009
78
50
44
10
60
34
57
39
14
2010
66
46
45
11
57
35
58
39
14
2011
68
47
43
12
55
33
57
39
14
2012
72
44
41
10
54
35
55
32
14
Source:
Own calculations based on UN COMTRADE data
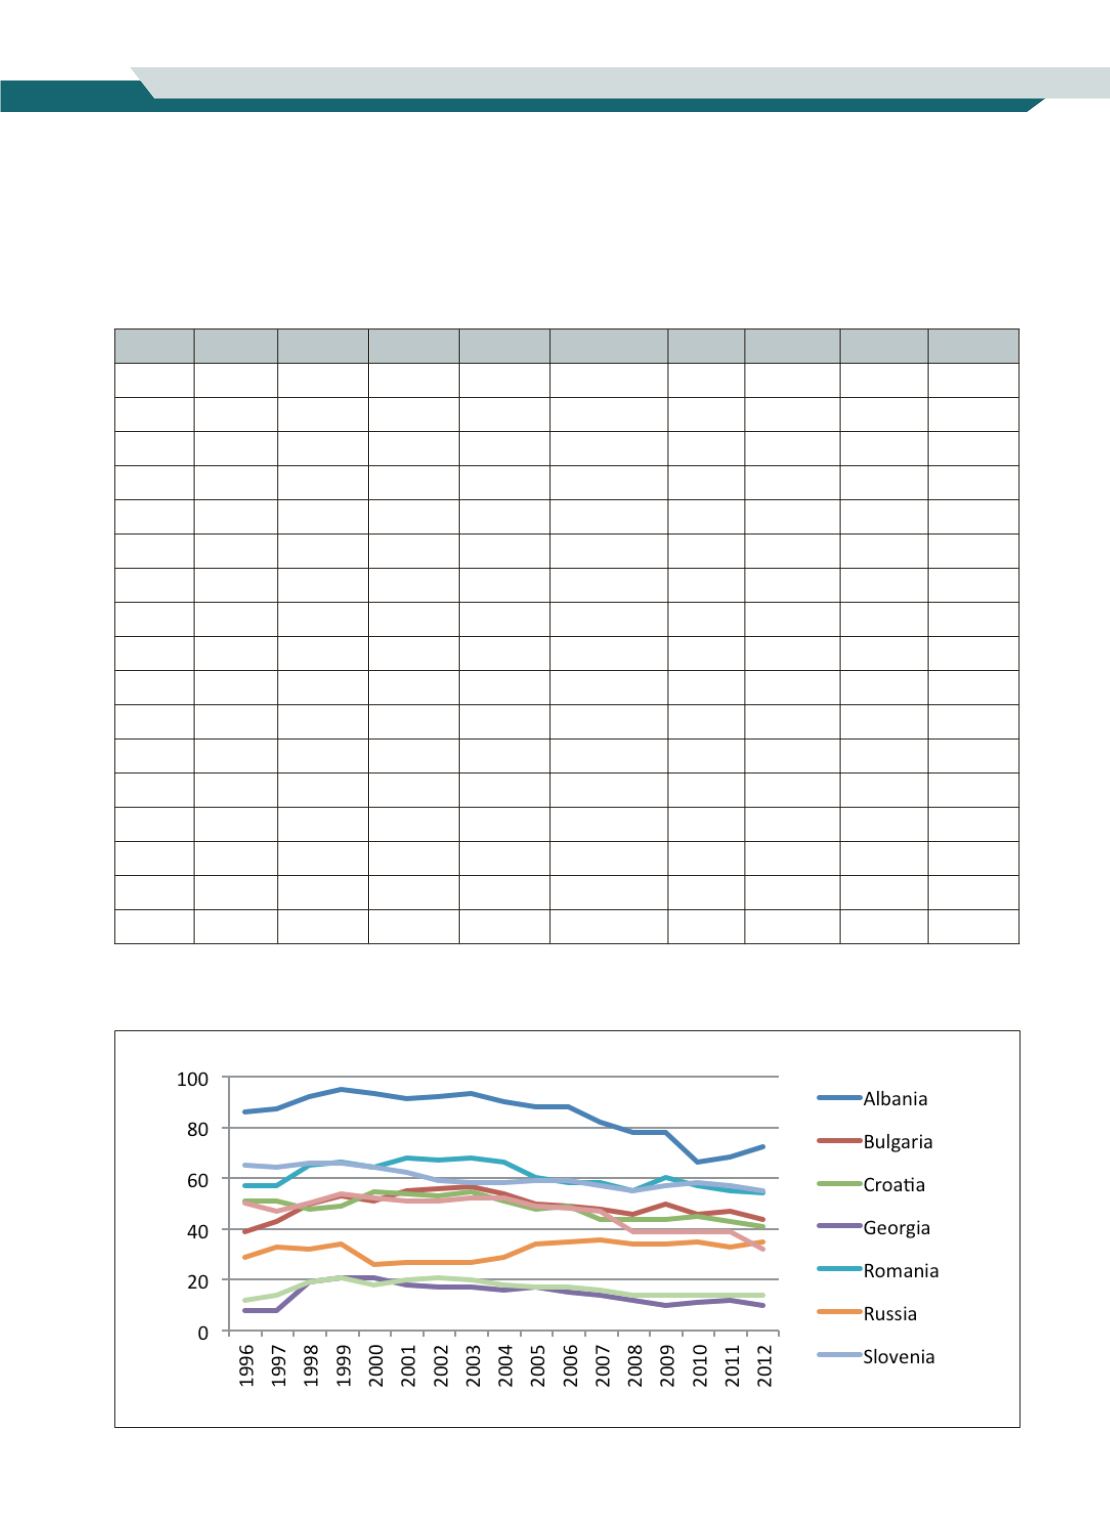
Figure 1:
Share of Selected BBSCs in EU-15 Exports, %